Dr Germán Rosas-Acosta
32 minutes
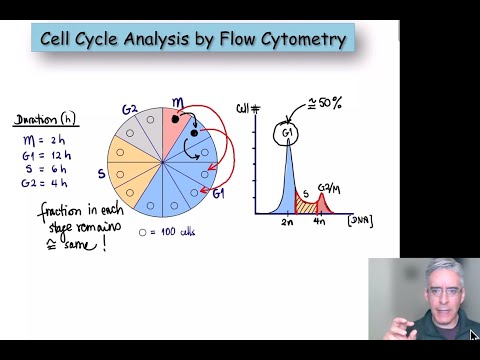
Flow cytometry enables measurement of cell cycle stage distribution within a cell population by using a DNA-intercalating fluorescent dye whose stoichiometric binding is proportional to cellular DNA content, exploiting the fact that DNA content doubles across the cell cycle (diploid in G1, intermediate during S-phase replication, tetraploid in G2/M). Progression through the four cell cycle stages (G1, S, G2, M) is governed by stimulatory signals (growth factors driving passage through the restriction point, versus quiescence/G0 in their absence) and by repressive checkpoint controls that verify DNA integrity, completion of replication, and proper chromosomal-spindle attachment before allowing continued progression, triggering apoptosis when damage cannot be resolved. This body of theory belongs to cell biology / cell cycle regulation, and the resulting DNA-content histogram (with its G1 peak, S-phase valley, G2/M peak, and sub-G1 apoptotic/"pre-G1" peak) is interpretable because the proportion of cells found in each stage at any instant reflects the relative duration of that stage within the overall cycle.